One of the key performance counters in a vSphere enviroment is: CPU ready (%rdy in ESXTOP)
CPU ready is the time a virtual CPU is ready to run but is not being scheduled on a physical CPU. This would under normal circumstances indicate that there is not enough physical CPU resources on an ESX/ESXi host. This is the first go-to counter when your users complain about bad performance.
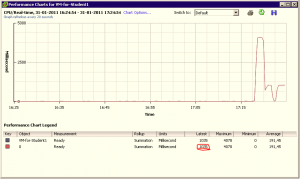
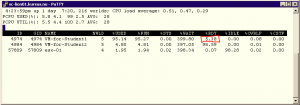
The CPU ready counter is accessible from the vSphere Client and from ESXTOP. I have made two screenshots showing the a virtual machine and its ready time:
vCenter Performance Graphs (Value 1035 milliseconeds)
ESXTOP (value 5.38%)
What we see is a virtual machine with a ready time of 1035 ms. or 5.38%. These numbers are actually telling us the same thing. When we are using the performance graphs the graph updates every 20 second (or 20,000 millisecond). With a ready time of 1035 ms. we can change it to a percentage: (1035 ms. x 100) / 20000 ms = 5,175%
To be able to interprept ready times it is essential to know the relationship between the percentage of ESXTOP and ms. of the Performance Graphs. You are seeing the same numbers. One is in milliseconds the other is a percentage.
1% = 200 ms.
5% = 1,000 ms.
10% = 2,000 ms.
100% = 20,000 ms.
In general you want to see virtual machines with a ready time lower than 1000 ms. or 5%.
Read more about ESXTOP here
Just heard of a cool calculator to convert cpu ready times to a percentage: http://www.vmcalc.com/


Hi Frank,
Ive been lookig intio a suspected CPUready issue for a while. The perfornce graph is from a host in a cluster 4 node cluster running a XenApp 6/6.5 Farm, so the load is much like VDI. We are over allocated on vcpu’s and performnce seems inconsitent and a bit sluggish intermitently. The host in question is a HP G7 DL585 48core AMD Opteron with 256GB of ram.
Ive just logged a call with VMware about this but the engineer doesnt’ seem to there is a CPU ready problem. Everything I can find seems to agree with your statement that more than 1000ms indicates problem.
I’m totally open to the fact I may be misreading the performnce graph attached to this post. But to me it seems to show that we have a number of guests with circa 37.5% CPU ready? If this is the case thsi is quiet bad and coudl be recified by reducing the over allocation of vcpu’s right? All but a few gusts have 2vcpu’s and some have only 1 so the overallocation comes from running lots of guests.
If you or any of your reader have any thoughts on this I’d liek to hear them 🙂
Hi Nick,
By looking at the graph I can see that the highest recorded CPU ready value (in the last hour) is 719 for the machine prdpdc-ctx236. (719ms*100)/20000ms == 3,595%. This graph is per host. ctx236 probably have more than one vCpu if it has two it is only 1.8% ready pr. vCpu. This is good numbers.
The only number that is higher than 1000 is p-hq-esx09.cqli.int – but this is the ESXi host itself. This is a summation of all the ready values of all the machines on this host. So this value is also no problem
It would be great if you could post an advanced performance graph directly from one of your Citrix servers. Make the graph real-time and show the counters. Usage, used, ready.CheersFrank
Hi Frank, Thanks for the prompt reply. Much appreciated.
I will see if I can post the graph when I get back to the office.
I’m pretty sure I’m mis-understaning something about the stacked VM graph I posted, based on your reply above.
The scale on the y axis seems to show virtual machines above the 7500ms division.
I thought it was a simple case of dividing by 200 for realtime graphs to get the % CPU ready time as per this KB.
http://kb.vmware.com/selfservice/microsites/search.do?language=en_US&cmd=displayKC&externalId=2002181
That would make the 7500ms division equal to 37.5% CPU ready.
Am I out by a factor of 10?
It sounds like this division actually equates to 3.75% in which case its happy days and the hypervisor is doing a good job in scheduling the workload as even the worst VMs are still averaging no more than about 5% cpu ready.
Many thanks.
It is a stacked graph. The SUM of all virtual machines is over 7500 MS ready. But highest one for individual machine is only 719.
You need no look at the numbers below the graph. Lastest is the ready vaule for the past 20 seconds. Highest is highest recorded value in the last hour. To do the math:
(719ms*100)/20000ms = 3.595%
Great and simple explanation, i love the ratio between
% and Ms
Gaby